Arrows
arrows(cmd0::String="", arg1=nothing; arrow=(...), kwargs...)Plots an arrow field. When the keyword arrow=(...) or vector=(...) is used, the direction (in degrees counter-clockwise from horizontal) and length must be found in columns 3 and 4, and size, if not specified on the command-line, should be present in column 5. The size is the length of the vector head. Vector stem width is set by option pen or line_attrib.
The vecmap=(...) variation is similar to above except azimuth (in degrees east of north) should be given instead of direction. The azimuth will be mapped into an angle based on the chosen map projection. If length is not in plot units but in arbitrary user units (e.g., a rate in mm/yr) then you can use the input_col option to scale the corresponding column via the +sscale modifier.
The geovec=(...) or geovector=(...) keywords plot geovectors. In geovectors, azimuth (in degrees east from north) and geographical length must be found in columns 3 and 4. The size is the length of the vector head. Vector width is set by pen or line_attrib. Note: Geovector stems are drawn as thin filled polygons and hence pen attributes like dashed and dotted are not available. For allowable geographical units, see the units=() option.
The full arrow options list can be consulted at Vector Attributes
B | frame | axis | xaxis yaxis:: [Type => Str]
Set map boundary frame and axes attributes. (http://docs.generic-mapping-tools.org/latest/gmt.html#b-full)
J | proj | projection :: [Type => String]
Select map projection. Defaults to 14x9.5 cm with linear (non-projected) maps. (http://docs.generic-mapping-tools.org/latest/gmt.html#j-full)
R | region | limits :: [Type => Str or list or GMTgrid|image] $Arg = (xmin,xmax,ymin,ymax)$
Specify the region of interest. Set to data minimum BoundinBox if not provided. (http://docs.generic-mapping-tools.org/latest/gmt.html#r-full)
W | pen | line_attrib :: [Type => Str]
Set pen attributes for lines or the outline of symbols (http://docs.generic-mapping-tools.org/latest/plot.html#w)
savefig | figname | name :: [Type => Str]
Save the figure with the
figname=name.extwhereextchooses the figure format (e.g. figname="name.png")
Example:
arrows([0 8.2 0 6], limits=(-2,4,0,9), arrow=(len=2,stop=1,shape=0.5,fill=:red), axis=:a, pen="6p", show=true)Examples
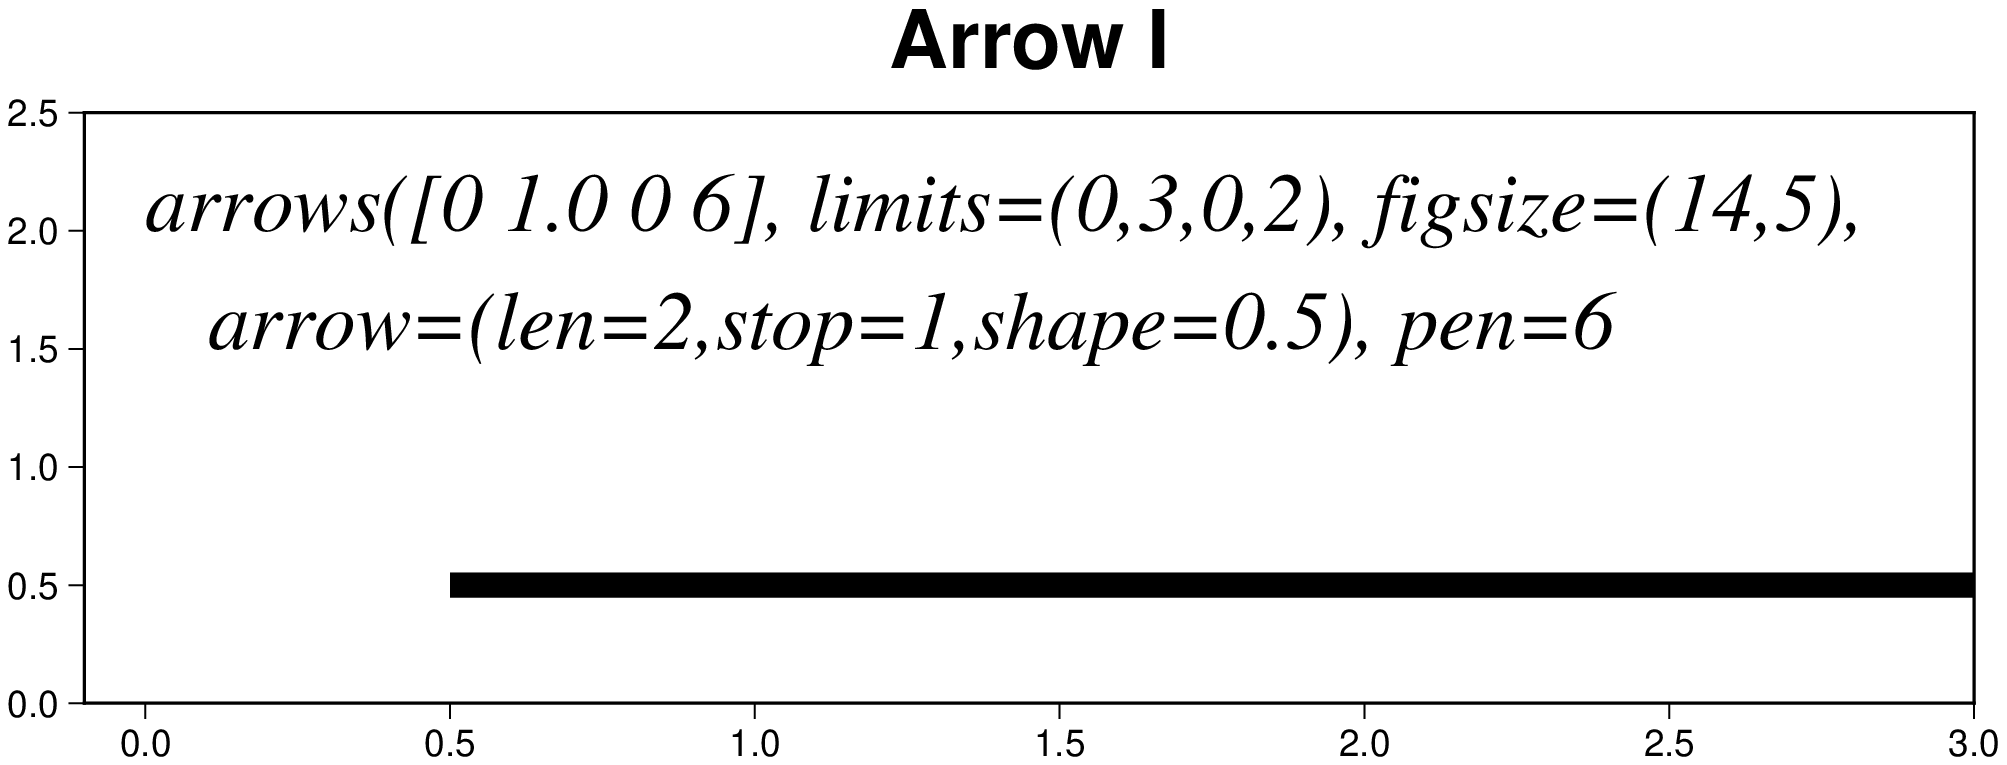
using GMT
arrows([0.5 0.5 0 8], limits=(-0.1,3,0,2.5), figsize=(16,5),
       arrow=(len=2,stop=1,shape=0.5), pen=6,
       frame=(axes=:WSrt, annot=:auto, title="Arrow I"))
# Add the plotting command to the figure
T1 = text_record([0 2.0], "arrows([0 1.0 0 6], limits=(0,3,0,2), figsize=(14,5),");
T2 = text_record([0 1.5], "   arrow=(len=2,stop=1,shape=0.5), pen=6");
pstext!(T1, font=(20,"Times-Italic"), justify=:LB)
pstext!(T2, font=(20,"Times-Italic"), justify=:LB, show=true)
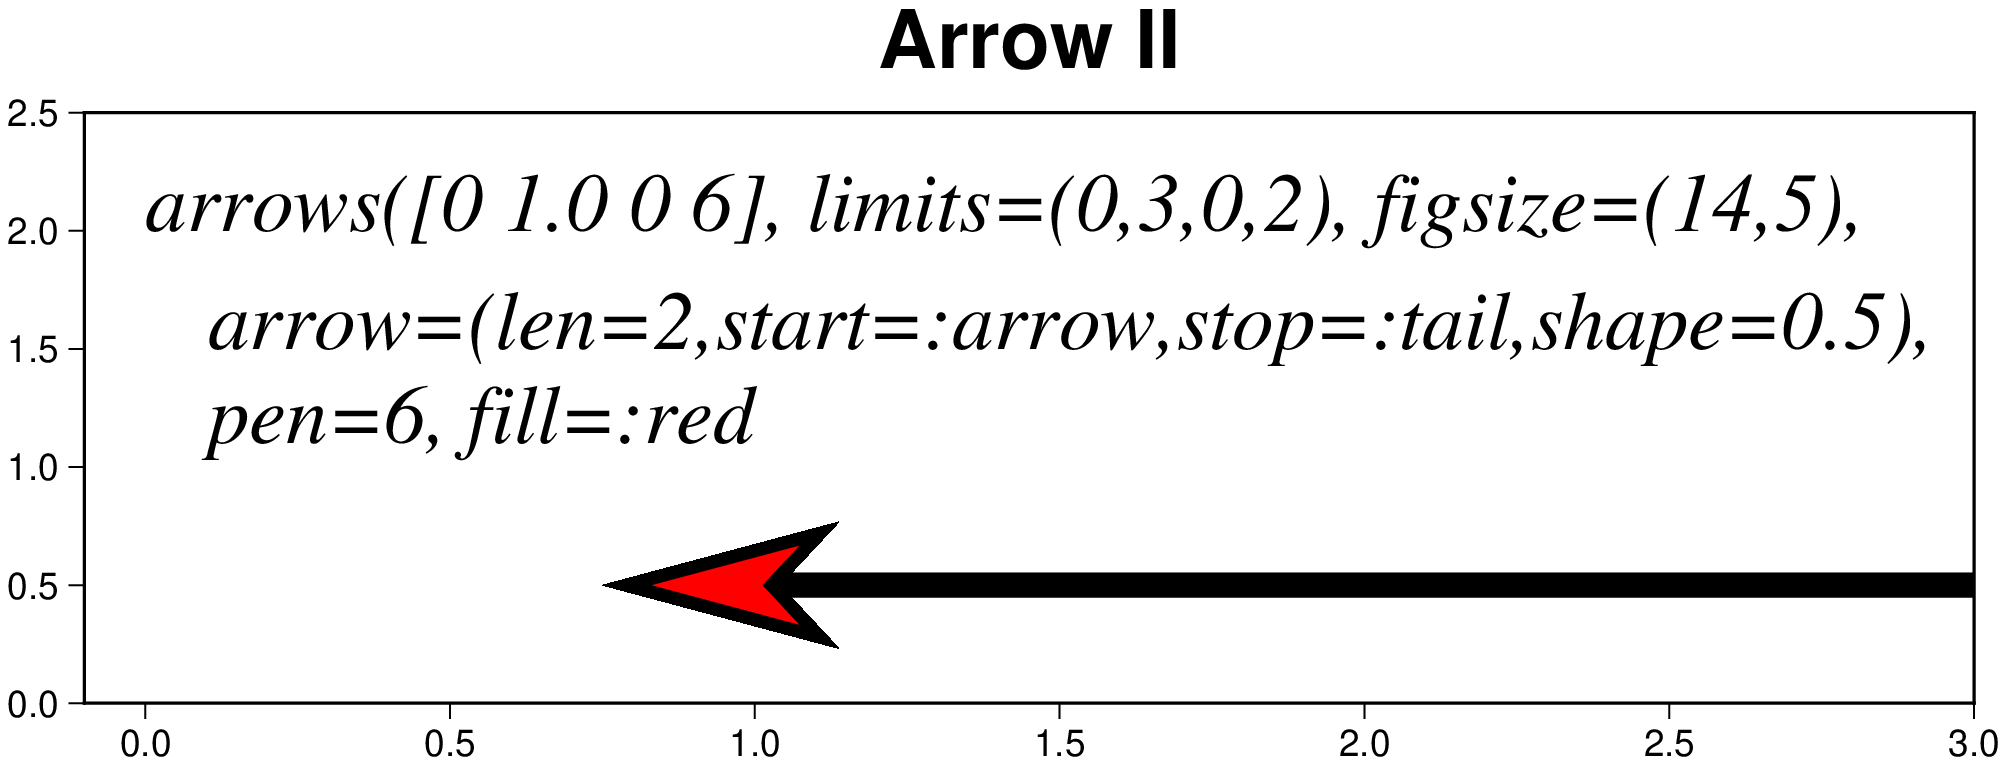
using GMT
arrows([0.75 0.5 0 8], limits=(-0.1,3,0,2.5), figsize=(16,5),
       arrow=(len=2,start=:arrow,stop=:tail,shape=0.5), fill=:red, pen=6,
       frame=(axes=:WSrt, annot=:auto, title="Arrow II"))
# Add the plotting command to the figure
T1 = text_record([0 2.0], "arrows([0 1.0 0 6], limits=(0,3,0,2), figsize=(14,5),");
T2 = text_record([0 1.5], "   arrow=(len=2,start=:arrow,stop=:tail,shape=0.5),");
T3 = text_record([0 1.1], "   pen=6, fill=:red");
pstext!(T1, font=(20,"Times-Italic"), justify=:LB)
pstext!(T2, font=(20,"Times-Italic"), justify=:LB)
pstext!(T3, font=(20,"Times-Italic"), justify=:LB, show=true)
GMT4 & GMT5 style arrows
Plot GMT4 style arrows. We show here three alternatives to set arrow heads
using GMT
arrows([1 0 45 4], region=(0,6,-1,1), J="x2.5",
       frame=(annot=0, grid=1, title="GMT4 Vectors"),
       pen=(1,:blue), fill=:red, arrow4=(align=:middle,
       head=(arrowwidth="4p", headlength="18p", headwidth="7.5p"), double=true))
arrows!([3 0 45 4], pen=(1,:blue), fill=:red,
        arrow4=(align=:middle, head=("4p","18p", "7.5p")))
arrows!([5 0 45 4], pen=(1,:blue), fill=:red,
        arrow4=(align=:middle, head="4p/18p/7.5p"))

# Now the GMT5 type arrows
arrows!([1 0 45 4], frame=(annot=0, grid=1, title="GMT5 Vectors"), lw=2, fill=:red,
        arrow=(length="18p", start=true, stop=true, pen=(1,:blue),
               angle=45, justify=:center, shape=0.5), yshift=7)
arrows!([3 0 45 4], lw=2, fill=:red,
        arrow=(length="18p", stop=true, pen="-", angle=45, justify=:center, shape=0.5))
arrows!([5 0 45 4], lw=2, fill=:red,
        arrow=(length="18p", stop=true, angle=45, justify=:center, shape=0.5), show=true)

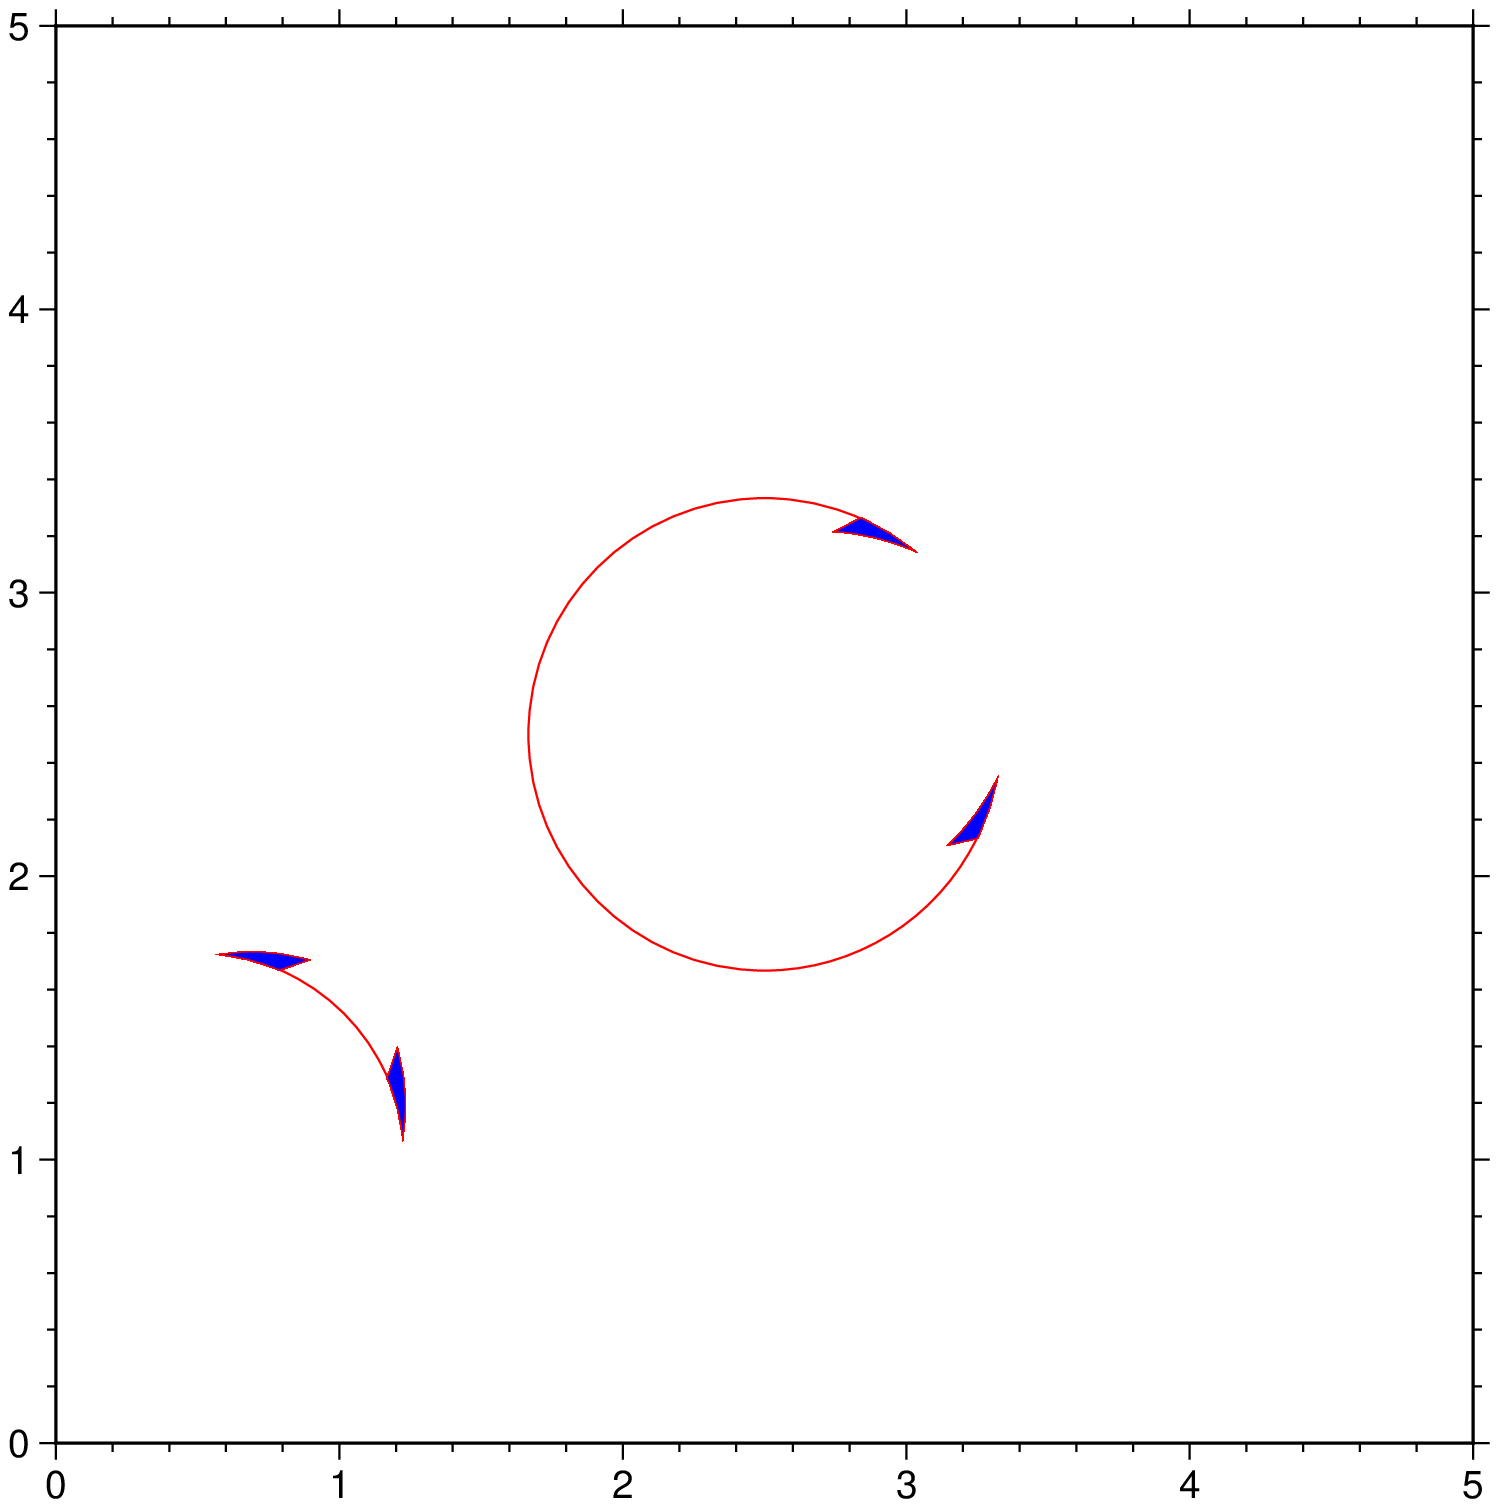
Mat angles
Plot matangle symbols with vector heads.
using GMT
plot([0.5 1 1.75 5 85], region=(0,5,0,5), figsize=12,
        marker=(matang=true, arrow=(length=0.75, start=true, stop=true, half=:right)),
        ml=(0.5,:red), fill=:blue)
# Now add another matangle symbol but transmit the angle parameters via the
# keyword. Note that in this case the arrow attributes are wrapped in a NamedTuple
plot!([2.5 2.5], marker=(:matang, [2 50 350], (length=0.75, start=true, stop=true, half=:left)),
        ml=(0.5,:red), fill=:blue, show=true)
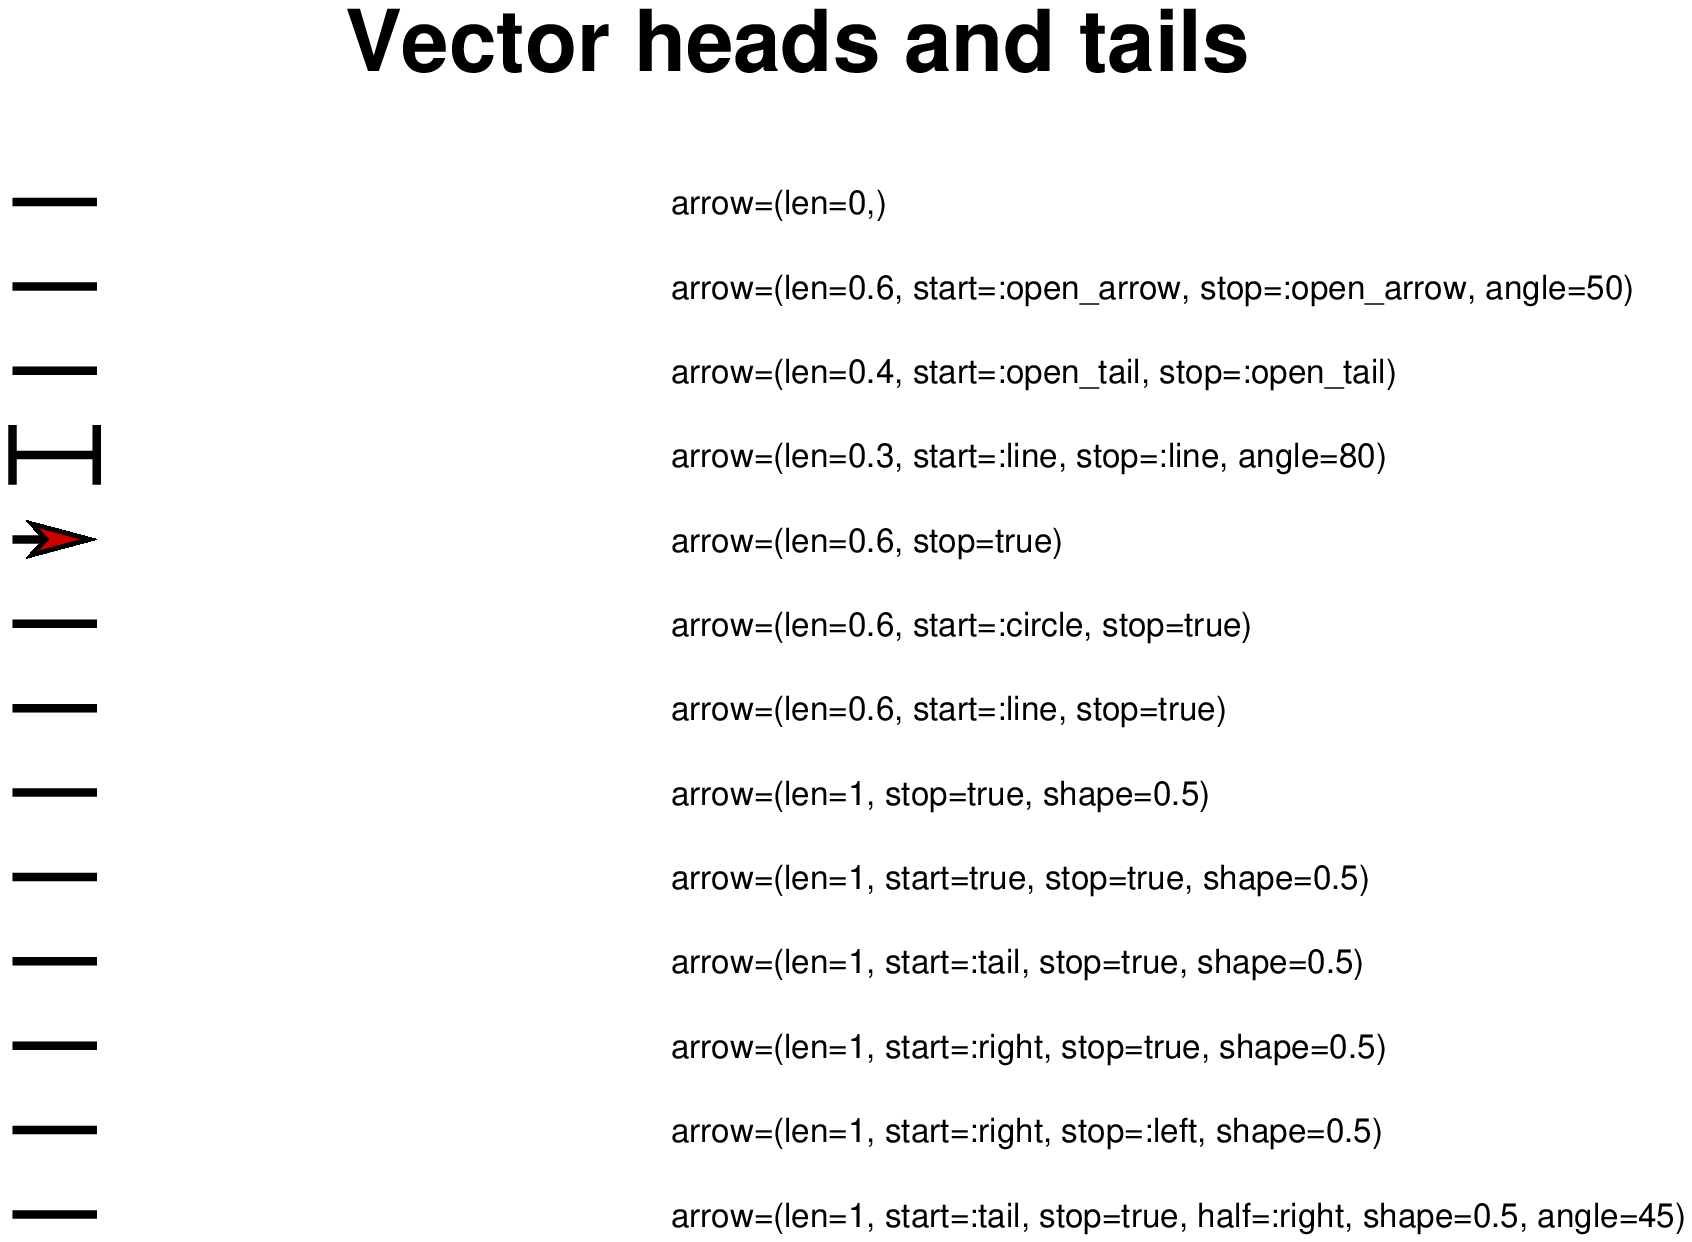
Vector heads and tails
There are many methods to plot vectors with individual heads and tails. For this purpose, several modifiers may be set to the corresponding vector-producing parameters for specifying the placement of vector heads and tails, their shapes, and the justification of the vector, see more at Vector Attributes.
using GMT

arrows([1 14 0 5], limits=(-5,100,1,15), figsize=(15,10), pen=2, arrow=(len=0,),
       frame=:none, title="Vector heads and tails")
text!(["arrow=(len=0,)"], x=40, y=14, font=8, justify=:LM)
arrows!([1 13 0 5], pen=2, arrow=(len=0.6, start=:open_arrow, stop=:open_arrow, angle=50))
text!(["arrow=(len=0.6, start=:open_arrow, stop=:open_arrow, angle=50)"], x=40, y=13, font=8, justify=:LM)
arrows!([1 12 0 5], pen=2, arrow=(len=0.4, start=:open_tail, stop=:open_tail))
text!(["arrow=(len=0.4, start=:open_tail, stop=:open_tail)"], x=40, y=12, font=8, justify=:LM)
arrows!([1 11 0 5], pen=2, arrow=(len=0.3, start=:line, stop=:line, angle=80))
text!(["arrow=(len=0.3, start=:line, stop=:line, angle=80)"], x=40, y=11, font=8, justify=:LM)
arrows!([1 10 0 5], pen=2, arrow=(len=0.6, stop=true), fill=:red3)
text!(["arrow=(len=0.6, stop=true)"], x=40, y=10, font=8, justify=:LM)
arrows!([1  9 0 5], pen=2, arrow=(len=0.6, start=:circle, stop=true), fill=:red3)
text!(["arrow=(len=0.6, start=:circle, stop=true)"], x=40, y=9, font=8, justify=:LM)
arrows!([1  8 0 5], pen=2, arrow=(len=0.6, start=:line, stop=true), fill=:red3)
text!(["arrow=(len=0.6, start=:line, stop=true)"], x=40, y=8, font=8, justify=:LM)
arrows!([1  7 0 5], pen=2, arrow=(len=1, stop=true, shape=0.5), fill=:red3)
text!(["arrow=(len=1, stop=true, shape=0.5)"], x=40, y=7, font=8, justify=:LM)
arrows!([1  6 0 5], pen=2, arrow=(len=1, start=true, stop=true, shape=0.5), fill=:red3)
text!(["arrow=(len=1, start=true, stop=true, shape=0.5)"], x=40, y=6, font=8, justify=:LM)
arrows!([1  5 0 5], pen=2, arrow=(len=1, start=:tail, stop=true, shape=0.5), fill=:red3)
text!(["arrow=(len=1, start=:tail, stop=true, shape=0.5)"], x=40, y=5, font=8, justify=:LM)
arrows!([1  4 0 5], pen=2, arrow=(len=1, start=:right, stop=true, shape=0.5), fill=:red3)
text!(["arrow=(len=1, start=:right, stop=true, shape=0.5)"], x=40, y=4, font=8, justify=:LM)
arrows!([1  3 0 5], pen=2, arrow=(len=1, start=:right, stop=:left, shape=0.5), fill=:red3)
text!(["arrow=(len=1, start=:right, stop=:left, shape=0.5)"], x=40, y=3, font=8, justify=:LM)
arrows!([1  2 0 5], pen=2, arrow=(len=1, start=:tail, stop=true, half=:right, shape=0.5, angle=45), fill=:red3)
text!(["arrow=(len=1, start=:tail, stop=true, half=:right, shape=0.5, angle=45)"], x=40, y=2, font=8, justify=:LM)
showfig()
These docs were autogenerated using GMT: v0.44.6